Integration of CITE-seq and scRNA-seq data#
Here we demonstrate how to integrate CITE-seq and scRNA-seq datasets with totalVI. The same principles here can be used to integrate CITE-seq datasets with different sets of measured proteins.
Note
Running the following cell will install tutorial dependencies on Google Colab only. It will have no effect on environments other than Google Colab.
!pip install --quiet scvi-colab
from scvi_colab import install

install()
WARNING: Running pip as the 'root' user can result in broken permissions and conflicting behaviour with the system package manager. It is recommended to use a virtual environment instead: https://pip.pypa.io/warnings/venv
import tempfile

import matplotlib.pyplot as plt
import numpy as np
import pandas as pd
import plotnine as p9
import scanpy as sc
import scvi
import seaborn as sns
import torch
from scipy.stats import pearsonr
Imports and data loading#
scvi.settings.seed = 0
print("Last run with scvi-tools version:", scvi.__version__)
Last run with scvi-tools version: 1.1.0
Note
You can modify save_dir below to change where the data files for this tutorial are saved.
sc.set_figure_params(figsize=(6, 6), frameon=False)
sns.set_theme()
torch.set_float32_matmul_precision("high")
save_dir = tempfile.TemporaryDirectory()

%config InlineBackend.print_figure_kwargs={"facecolor": "w"}
%config InlineBackend.figure_format="retina"
Here we focus on two CITE-seq datasets of peripheral blood mononuclear cells from 10x Genomics and used in the totalVI manuscript. We have already filtered these datasets for doublets and low-quality cells and genes.
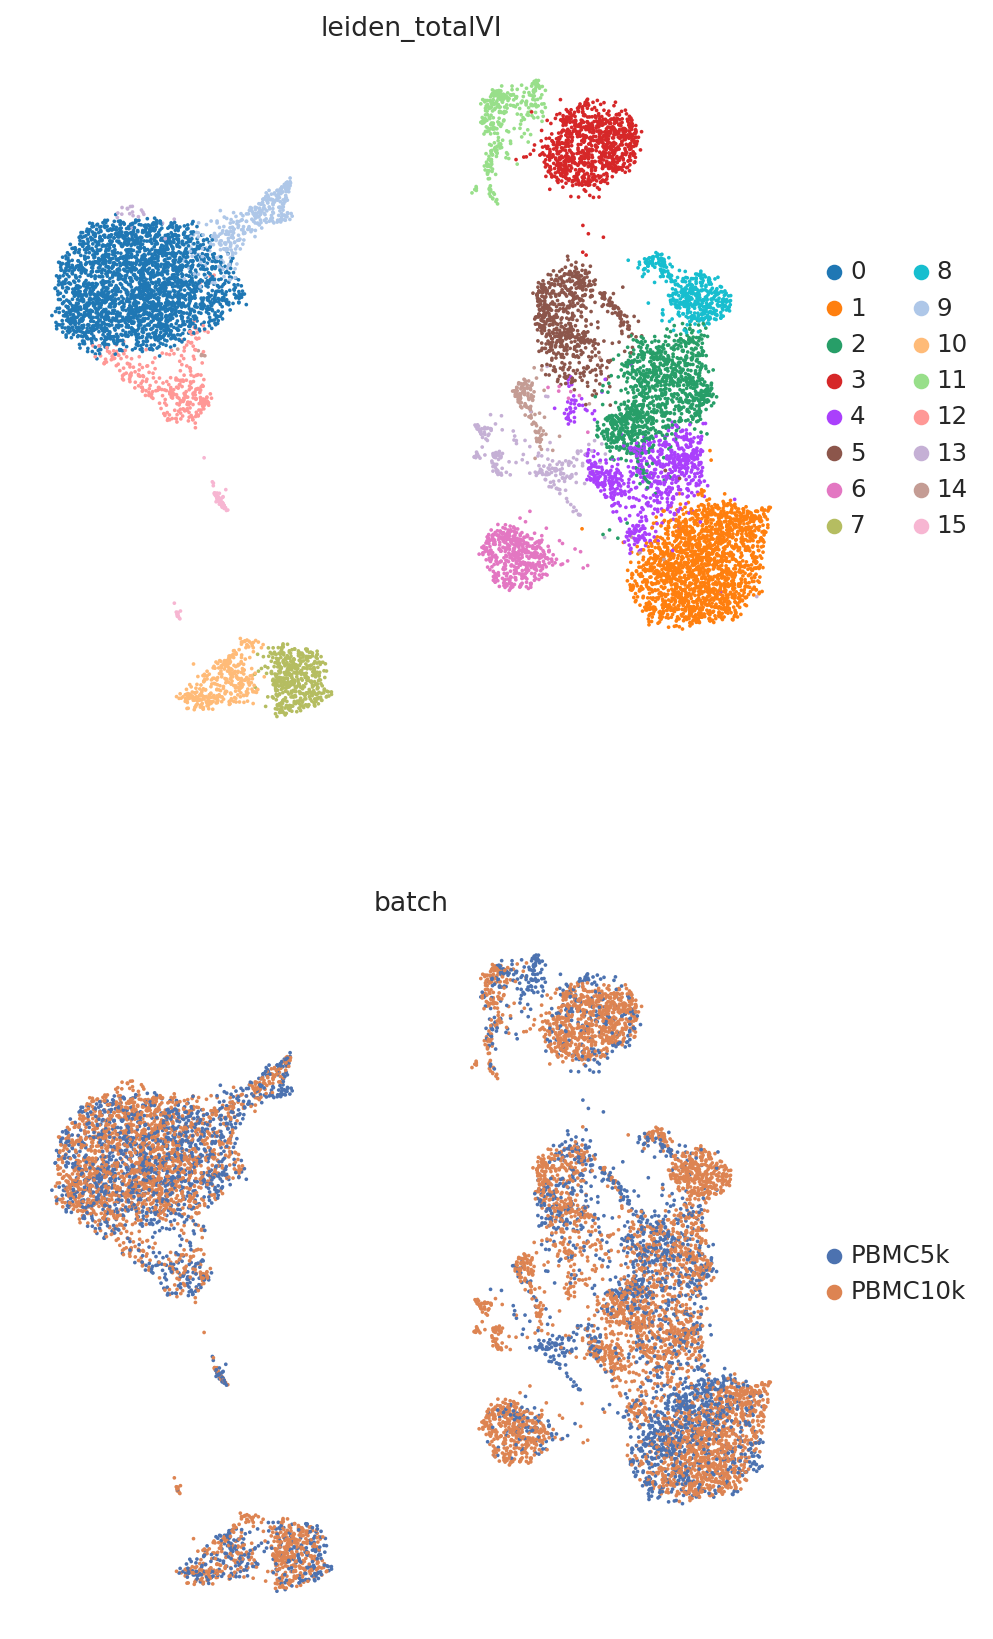
The quality of totalVI’s protein imputation is somewhat reliant on how well the datasets mix in the latent space. In other words, it’s assumed here the datasets largely share the same cell subpopulations.
adata = scvi.data.pbmcs_10x_cite_seq(save_path=save_dir.name)
INFO     Downloading file at /tmp/tmpx7t_7_u1/pbmc_10k_protein_v3.h5ad
Downloading...: 24938it [00:00, 92608.95it/s]
INFO     Downloading file at /tmp/tmpx7t_7_u1/pbmc_5k_protein_v3.h5ad
Downloading...: 100%|██████████| 18295/18295.0 [00:00<00:00, 81648.91it/s]
# batch 0 corresponds to dataset_10k, batch 1 corresponds to dataset_5k
batch = adata.obs.batch.values.ravel()
adata.obs.batch
index
AAACCCAAGATTGTGA-1    PBMC10k
AAACCCACATCGGTTA-1    PBMC10k
AAACCCAGTACCGCGT-1    PBMC10k
AAACCCAGTATCGAAA-1    PBMC10k
AAACCCAGTCGTCATA-1    PBMC10k
                       ...
TTTGGTTGTACGAGTG-1     PBMC5k
TTTGTTGAGTTAACAG-1     PBMC5k
TTTGTTGCAGCACAAG-1     PBMC5k
TTTGTTGCAGTCTTCC-1     PBMC5k
TTTGTTGCATTGCCGG-1     PBMC5k
Name: batch, Length: 10849, dtype: object
Now we hold-out the proteins of the 5k dataset. To do so, we can replace all the values with 0s. We will store the original values to validate after training.
held_out_proteins = adata.obsm["protein_expression"][batch == "PBMC5k"].copy()
adata.obsm["protein_expression"].loc[batch == "PBMC5k"] = np.zeros_like(
    adata.obsm["protein_expression"][batch == "PBMC5k"]
)
sc.pp.highly_variable_genes(
    adata, batch_key="batch", flavor="seurat_v3", n_top_genes=4000, subset=True
)
Important
scvi-tools will automatically detect proteins as missing in a certain batch if the protein has 0 counts for each cell in the batch. In other words, to indicate a protein is missing in a certain batch, please set it to 0 for each cell.
scvi.model.TOTALVI.setup_anndata(
    adata, batch_key="batch", protein_expression_obsm_key="protein_expression"
)
INFO     Using column names from columns of adata.obsm['protein_expression']
INFO     Found batches with missing protein expression
Prepare and run model#
model = scvi.model.TOTALVI(adata, latent_distribution="normal", n_layers_decoder=2)
INFO Computing empirical prior initialization for protein background.
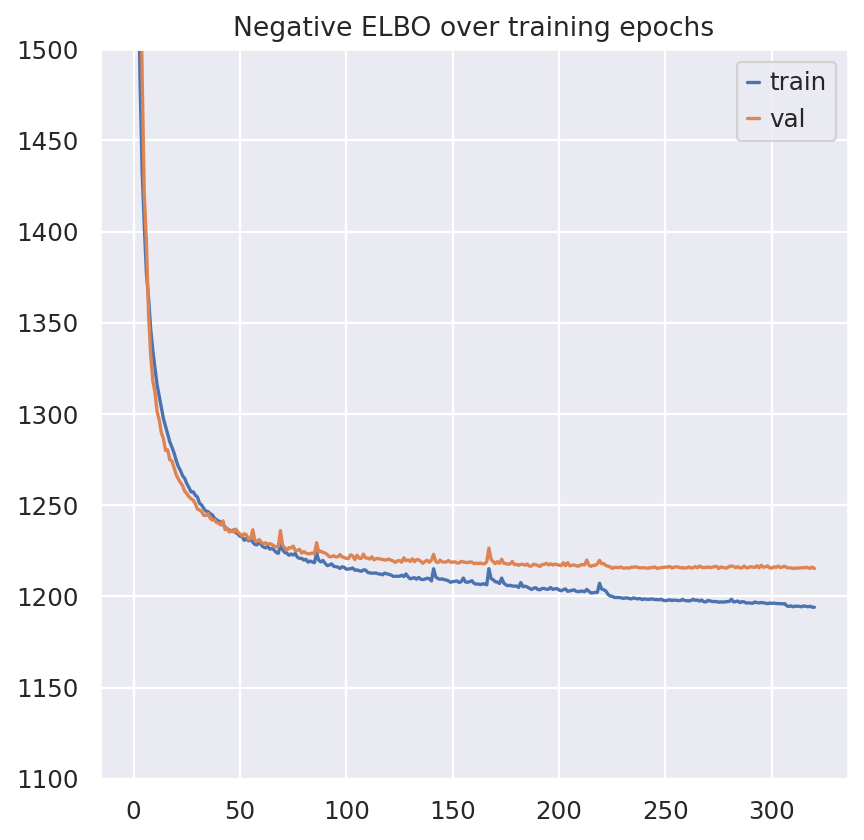
model.train()
Epoch 223/400:  56%|█████▌    | 222/400 [02:01<01:34,  1.89it/s, v_num=1, train_loss_step=1.4e+3, train_loss_epoch=1.2e+3]Epoch 00223: reducing learning rate of group 0 to 2.4000e-03.
Epoch 307/400:  76%|███████▋  | 306/400 [02:46<00:49,  1.89it/s, v_num=1, train_loss_step=1.34e+3, train_loss_epoch=1.2e+3]Epoch 00307: reducing learning rate of group 0 to 1.4400e-03.
Epoch 321/400:  80%|████████  | 321/400 [02:54<00:42,  1.84it/s, v_num=1, train_loss_step=1.41e+3, train_loss_epoch=1.19e+3]
Monitored metric elbo_validation did not improve in the last 45 records. Best score: 1215.338. Signaling Trainer to stop.
plt.plot(model.history["elbo_train"], label="train")
plt.plot(model.history["elbo_validation"], label="val")
plt.title("Negative ELBO over training epochs")
plt.ylim(1100, 1500)
plt.legend()
<matplotlib.legend.Legend at 0x7fc2742c3d90>

Analyze outputs#
Again, we rely on Scanpy.
TOTALVI_LATENT_KEY = "X_totalVI"
PROTEIN_FG_KEY = "protein_fg_prob"

adata.obsm[TOTALVI_LATENT_KEY] = model.get_latent_representation()
adata.obsm[PROTEIN_FG_KEY] = model.get_protein_foreground_probability(
    transform_batch="PBMC10k"
)

rna, protein = model.get_normalized_expression(
    transform_batch="PBMC10k", n_samples=25, return_mean=True
)
Note
transform_batch is a powerful parameter. Setting this allows one to predict the expression of cells as if they came from the inputted batch. In this case, we’ve observed protein expression in batch “PBMC10k” (batch categories from original adata object), but we have no protein expression in batch “PBMC5k”. We’d like to take the cells of batch “PBMC5k” and make a counterfactual prediction: “What would the expression look like if my batch “PBMC5k” cells came from batch “PBMC10k”?”
protein.iloc[:5, :5]
| CD3_TotalSeqB | CD4_TotalSeqB | CD8a_TotalSeqB | CD14_TotalSeqB | CD15_TotalSeqB | |
|---|---|---|---|---|---|
| index | |||||
| AAACCCAAGATTGTGA-1 | 9.201847 | 208.235474 | 1.050689 | 828.559753 | 101.846344 |
| AAACCCACATCGGTTA-1 | 27.201069 | 178.288391 | 3.560196 | 730.101562 | 99.247513 |
| AAACCCAGTACCGCGT-1 | 16.095518 | 367.685669 | 11.091118 | 1281.989258 | 119.586426 |
| AAACCCAGTATCGAAA-1 | 2.829181 | 2.205770 | 34.405991 | 0.069012 | 111.116081 |
| AAACCCAGTCGTCATA-1 | 0.800657 | 0.070629 | 63.542938 | 0.012470 | 101.414154 |
Important
The following is for illustrative purposes. In the code blocks above, we have the denoised protein values for each cell. These values have the expected protein background component removed. However, to compare to the held out protein values, we must include both protein foreground and background. We recommend using the values above for downstream tasks.
_, protein_means = model.get_normalized_expression(
    n_samples=25,
    transform_batch="PBMC10k",
    include_protein_background=True,
    sample_protein_mixing=False,
    return_mean=True,
)
TOTALVI_CLUSTERS_KEY = "leiden_totalVI"

sc.pp.neighbors(adata, use_rep=TOTALVI_LATENT_KEY)
sc.tl.umap(adata, min_dist=0.4)
sc.tl.leiden(adata, key_added=TOTALVI_CLUSTERS_KEY)
perm_inds = np.random.permutation(len(adata))
sc.pl.umap(
    adata[perm_inds],
    color=[TOTALVI_CLUSTERS_KEY, "batch"],
    ncols=1,
    frameon=False,
)

batch = adata.obs.batch.values.ravel()
combined_protein = np.concatenate(
    [adata.obsm["protein_expression"].values[batch == "PBMC10k"], held_out_proteins],
    axis=0,
)

# cleaner protein names
parsed_protein_names = [
    p.split("_")[0] for p in adata.obsm["protein_expression"].columns
]
for i, p in enumerate(parsed_protein_names):
    adata.obs[f"{p} imputed"] = protein_means.iloc[:, i]
    adata.obs[f"{p} observed"] = combined_protein[:, i]
viz_keys = []
for p in parsed_protein_names:
    viz_keys.append(p + " imputed")
    viz_keys.append(p + " observed")

sc.pl.umap(
    adata[adata.obs.batch == "PBMC5k"],
    color=viz_keys,
    ncols=2,
    vmax="p99",
    frameon=False,
    add_outline=True,
    wspace=0.1,
)

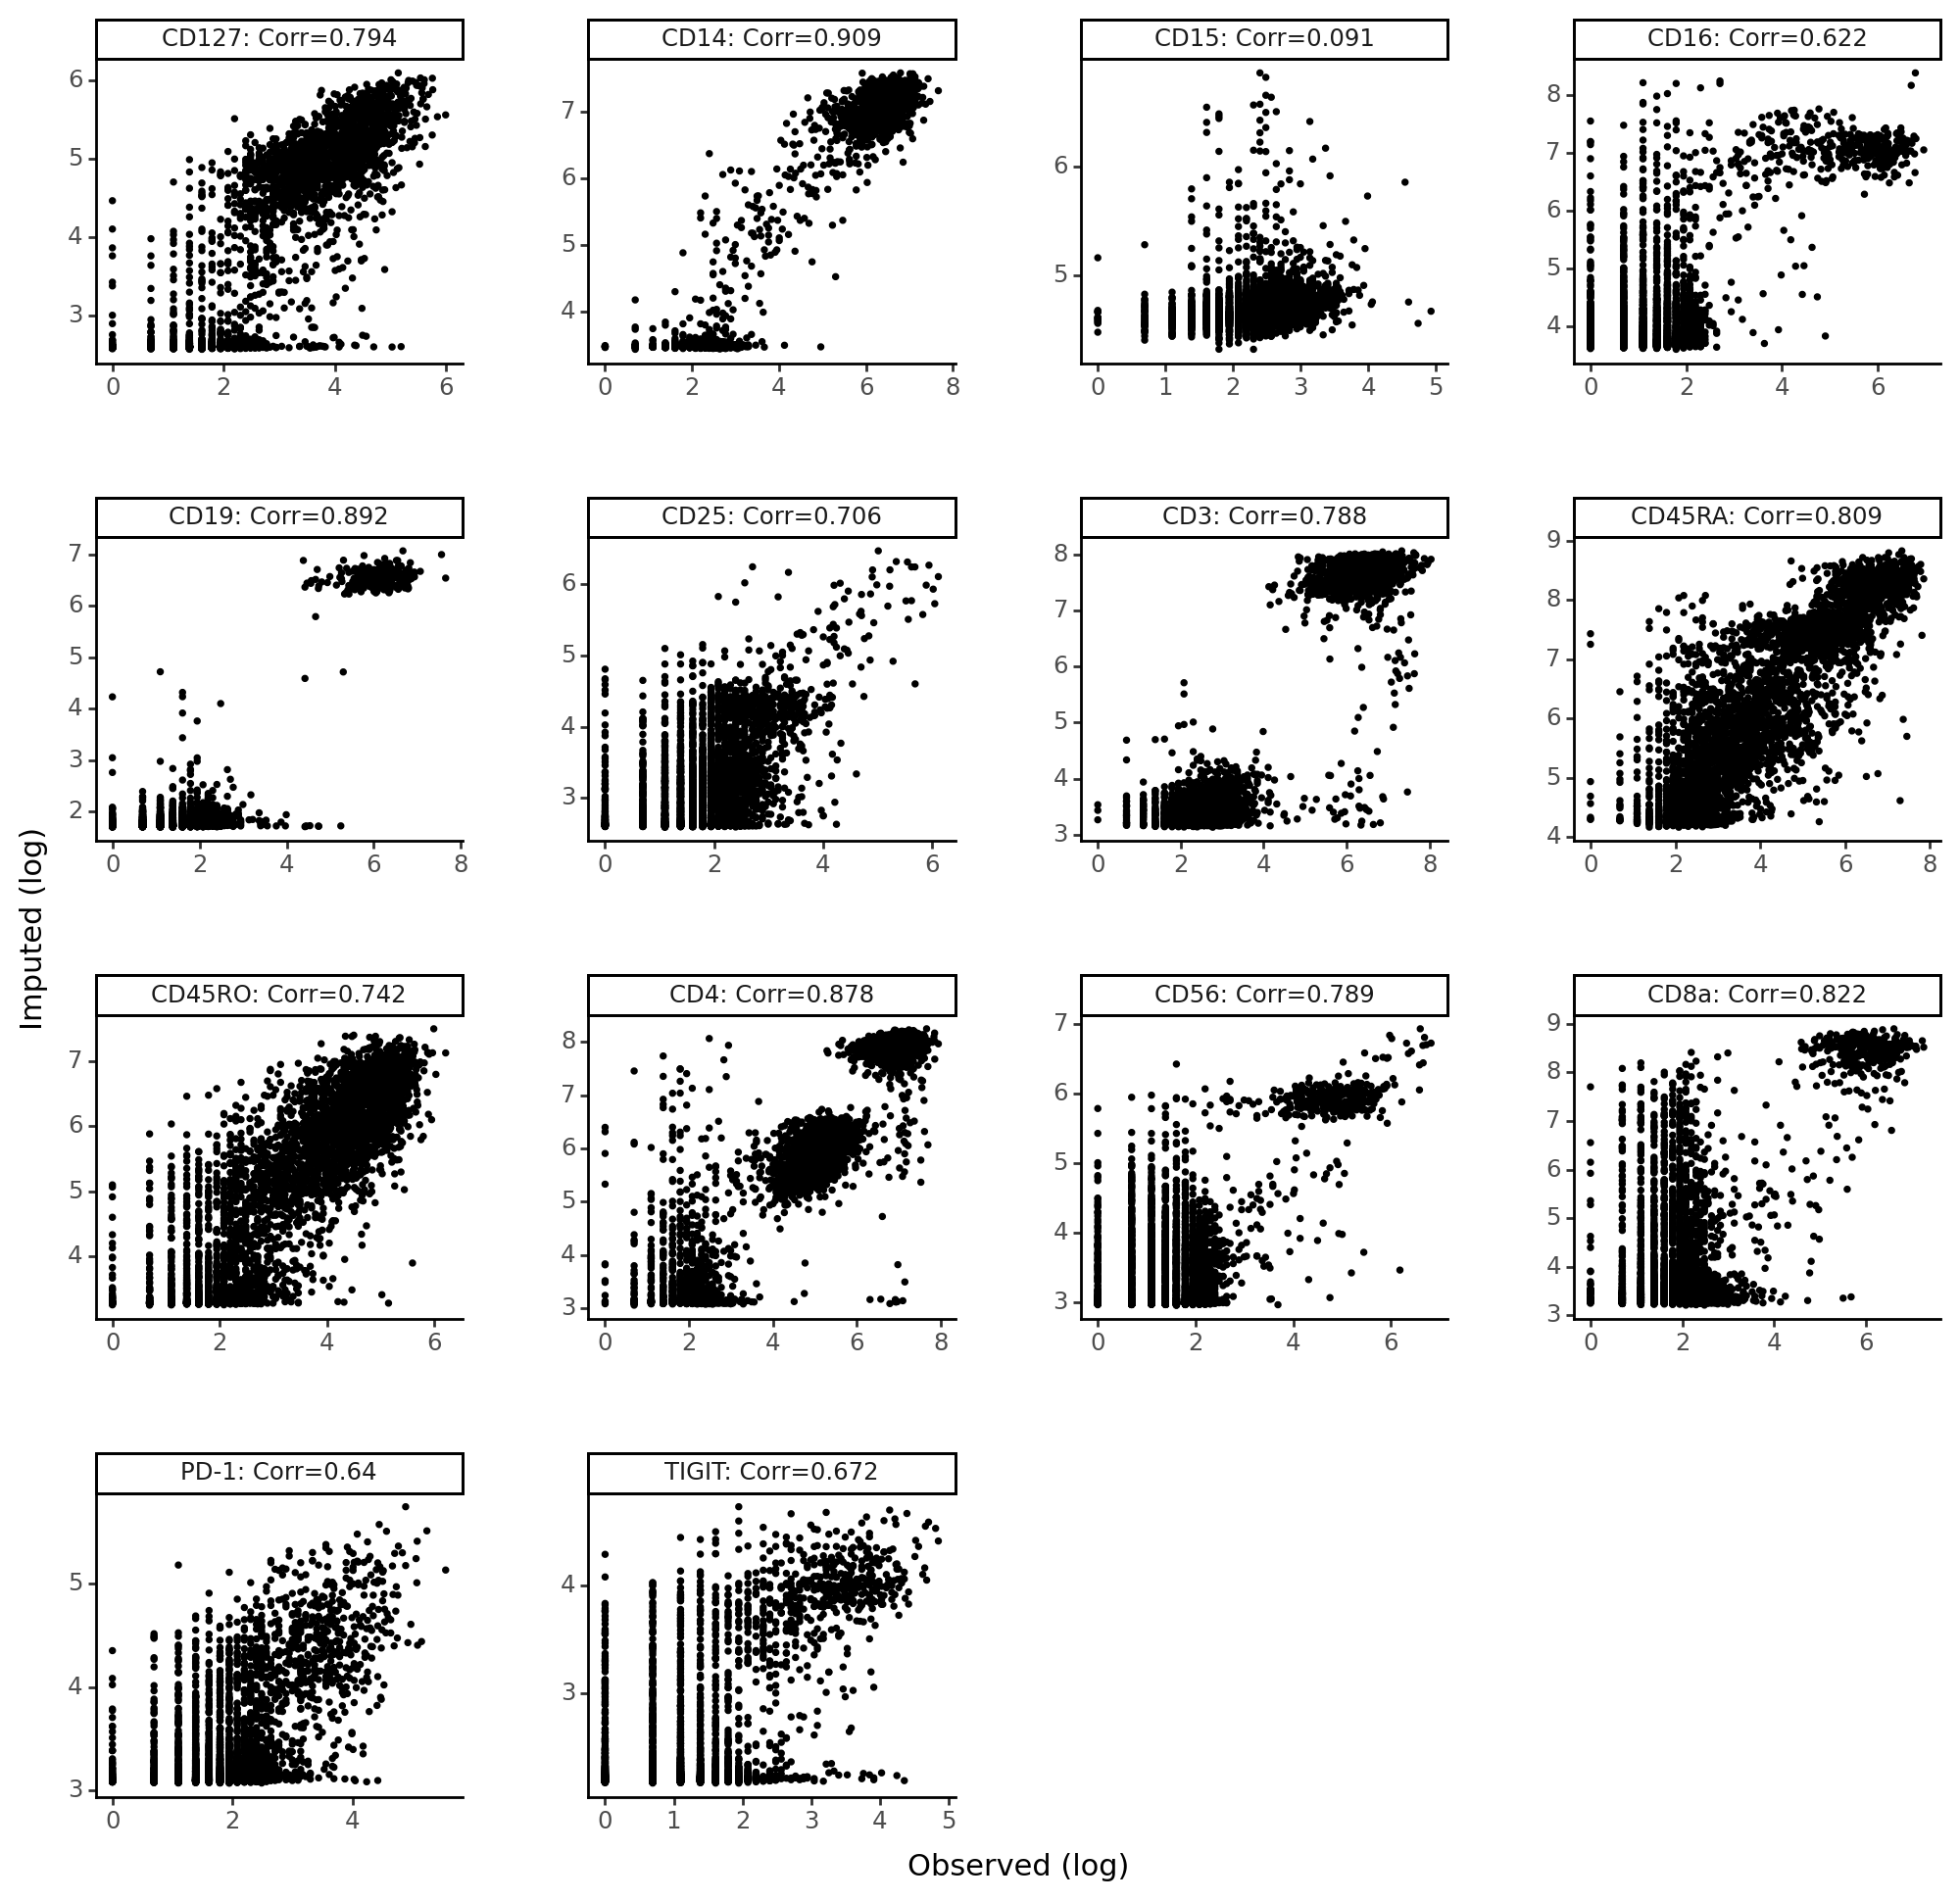
Imputed vs denoised correlations#
imputed_pros = protein_means[batch == "PBMC5k"]
held_vs_denoised = pd.DataFrame()
held_vs_denoised["Observed (log)"] = np.log1p(held_out_proteins.values.ravel())
held_vs_denoised["Imputed (log)"] = np.log1p(imputed_pros.to_numpy().ravel())
protein_names_corrs = []
for i, p in enumerate(parsed_protein_names):
    protein_names_corrs.append(
        parsed_protein_names[i]
        + ": Corr="
        + str(
            np.round(
                pearsonr(held_out_proteins.values[:, i], imputed_pros.iloc[:, i])[0], 3
            )
        )
    )
held_vs_denoised["Protein"] = protein_names_corrs * len(held_out_proteins)
held_vs_denoised.head()
| Observed (log) | Imputed (log) | Protein | |
|---|---|---|---|
| 0 | 3.258097 | 3.449117 | CD3: Corr=0.788 |
| 1 | 5.105945 | 5.991710 | CD4: Corr=0.878 |
| 2 | 2.833213 | 3.485250 | CD8a: Corr=0.822 |
| 3 | 6.546785 | 7.198724 | CD14: Corr=0.909 |
| 4 | 2.995732 | 4.774929 | CD15: Corr=0.091 |
We notice that CD15 has a really low correlation (imputation accuracy). Recall that imputation involves a counterfactual query – “what would the protein expression have been for these cells if they came from the PBMC10k dataset?” Thus, any technical issues with proteins in CD15 in PBMC10k will be reflected in the imputed values. It’s the case here that CD15 was not captured as well in the PBMC10k dataset compared to the PBMC5k dataset.
p9.theme_set(p9.theme_classic)
(
    p9.ggplot(held_vs_denoised, p9.aes("Observed (log)", "Imputed (log)"))
    + p9.geom_point(size=0.5)
    + p9.facet_wrap("~Protein", scales="free")
    + p9.theme(
        figure_size=(10, 10),
        panel_spacing=0.05,
    )
)

<Figure Size: (1000 x 1000)>

