MrVI analysis over Tahoe100M cells dataset#
MrVI (Multi-resolution Variational Inference) is a model for analyzing multi-sample single-cell RNA-seq data. This tutorial show how to do run MrVI in PyTorch version over the Tahoe100M cells dataset and perform basic analysis.
!pip install --quiet scvi-colab
from scvi_colab import install

install()
[notice] A new release of pip is available: 24.3.1 -> 26.1.2
[notice] To update, run: pip install --upgrade pip
import os
import tempfile

import matplotlib.pyplot as plt
import numpy as np
import pandas as pd
import rapids_singlecell as rsc
import scanpy as sc
import scvi
import scvi.hub
import seaborn as sns
import torch
from scvi.external import MRVI

run_autotune = False
# import inspect
# print(inspect.getsource(MRVI))
scvi.settings.seed = 0
print("Last run with scvi-tools version:", scvi.__version__)
Last run with scvi-tools version: 1.5.0
sc.set_figure_params(figsize=(6, 6), frameon=False)
sns.set_theme()
torch.set_float32_matmul_precision("high")
save_dir = tempfile.TemporaryDirectory()
tahoe_data_dir = os.environ.get("TAHOE_DATA_DIR", "Tahoe100M")

%config InlineBackend.print_figure_kwargs={"facecolor": "w"}
%config InlineBackend.figure_format="retina"
pd.set_option("display.max_rows", 50)
pd.set_option("display.max_columns", 50)
pd.set_option("display.width", 1000)
Get the data#
We start by downloading the model from its hub in order to use its metadata Note that the model is very large therefore it will take time to being download.
# get the hub data
tahoe_hubmodel = scvi.hub.HubModel.pull_from_huggingface_hub(
    repo_name="vevotx/Tahoe-100M-SCVI-v1", cache_dir="."
)
tahoe_hubmodel.model.adata.obs.head()
INFO     Loading model...
INFO     File ./models--vevotx--Tahoe-100M-SCVI-v1/snapshots/b5283a73fbbed812a95264ace360da538b20af89/model.pt
         already downloaded
| sample | species | gene_count | tscp_count | mread_count | bc1_wind | bc2_wind | bc3_wind | bc1_well | bc2_well | bc3_well | id | drugname_drugconc | drug | INT_ID | NUM.SNPS | NUM.READS | demuxlet_call | BEST.LLK | NEXT.LLK | DIFF.LLK.BEST.NEXT | BEST.POSTERIOR | SNG.POSTERIOR | SNG.BEST.LLK | SNG.NEXT.LLK | SNG.ONLY.POSTERIOR | DBL.BEST.LLK | DIFF.LLK.SNG.DBL | sublibrary | BARCODE | pcnt_mito | S_score | G2M_score | phase | pass_filter | dataset | _scvi_batch | _scvi_labels | _scvi_observed_lib_size | plate | Cell_Name_Vevo | Cell_ID_Cellosaur | observed_lib_size | |
|---|---|---|---|---|---|---|---|---|---|---|---|---|---|---|---|---|---|---|---|---|---|---|---|---|---|---|---|---|---|---|---|---|---|---|---|---|---|---|---|---|---|---|---|
| BARCODE_SUB_LIB_ID | |||||||||||||||||||||||||||||||||||||||||||
| 01_001_052-lib_1105 | smp_1783 | hg38 | 1878 | 2893 | 3284 | 1 | 1 | 52 | A1 | A1 | E4 | recgIHRi9MiCIr4CO | [('8-Hydroxyquinoline', 0.05, 'uM')] | 8-Hydroxyquinoline | 1.0 | 199.0 | 215.0 | singlet | -50.74 | -59.04 | 8.30 | -55.0 | 1.0 | -50.74 | -87.96 | 0.0 | -59.04 | 8.30 | lib_1105 | 01_001_052 | 0.019357 | 0.174603 | 0.179670 | G2M | full | 0 | 0 | 0 | 2893 | 4 | PANC-1 | CVCL_0480 | 2893 |
| 01_001_105-lib_1105 | smp_1783 | hg38 | 1765 | 2434 | 2764 | 1 | 1 | 105 | A1 | A1 | p2.A9 | recgIHRi9MiCIr4CO | [('8-Hydroxyquinoline', 0.05, 'uM')] | 8-Hydroxyquinoline | 3.0 | 137.0 | 140.0 | singlet | -37.97 | -42.41 | 4.44 | -43.0 | 1.0 | -37.97 | -64.52 | 0.0 | -42.41 | 4.44 | lib_1105 | 01_001_105 | 0.029581 | 0.297619 | 0.342857 | G2M | full | 0 | 0 | 0 | 2434 | 4 | SW480 | CVCL_0546 | 2434 |
| 01_001_165-lib_1105 | smp_1783 | hg38 | 3174 | 5691 | 6454 | 1 | 1 | 165 | A1 | A1 | p2.F9 | recgIHRi9MiCIr4CO | [('8-Hydroxyquinoline', 0.05, 'uM')] | 8-Hydroxyquinoline | 4.0 | 379.0 | 396.0 | singlet | -129.66 | -130.65 | 0.99 | -130.0 | 1.0 | -129.66 | -186.89 | 0.0 | -130.65 | 0.99 | lib_1105 | 01_001_165 | 0.031629 | 0.031746 | 0.099084 | G2M | full | 0 | 0 | 0 | 5691 | 4 | SW1417 | CVCL_1717 | 5691 |
| 01_003_094-lib_1105 | smp_1783 | hg38 | 1380 | 1804 | 2050 | 1 | 3 | 94 | A1 | A3 | H10 | recgIHRi9MiCIr4CO | [('8-Hydroxyquinoline', 0.05, 'uM')] | 8-Hydroxyquinoline | 7.0 | 122.0 | 125.0 | singlet | -31.79 | -33.98 | 2.19 | -36.0 | 1.0 | -31.79 | -49.36 | 0.0 | -33.98 | 2.19 | lib_1105 | 01_003_094 | 0.017738 | -0.063492 | 0.019780 | G2M | full | 0 | 0 | 0 | 1804 | 4 | SW1417 | CVCL_1717 | 1804 |
| 01_003_164-lib_1105 | smp_1783 | hg38 | 1179 | 1514 | 1715 | 1 | 3 | 164 | A1 | A3 | p2.F8 | recgIHRi9MiCIr4CO | [('8-Hydroxyquinoline', 0.05, 'uM')] | 8-Hydroxyquinoline | 8.0 | 87.0 | 93.0 | singlet | -28.99 | -27.07 | -1.92 | -34.0 | 1.0 | -28.99 | -41.61 | 0.0 | -27.07 | -1.92 | lib_1105 | 01_003_164 | 0.023118 | -0.075397 | -0.070879 | G1 | full | 0 | 0 | 0 | 1514 | 4 | A498 | CVCL_1056 | 1514 |
# Load Cell Line Metadata
cell_lines = pd.read_csv(os.path.join(tahoe_data_dir, "cell_line_metadata.h5ad"))
cell_lines.head()
# Load the .h5ad file
adata = sc.read_h5ad(os.path.join(tahoe_data_dir, "tahoe100m_sample_100000_rand.h5ad"))
adata.obs.head()
We use a subset of data, show the plates stratification and perform HVG filtering following by merging the metadata and split to train and test
adata.obs.plate.value_counts()
plate
plate4    28225
plate8    28225
plate3    28224
plate7    15326
Name: count, dtype: int64
# HVG filtering
sc.pp.highly_variable_genes(
    adata, n_top_genes=15000, inplace=True, subset=True, flavor="seurat_v3", batch_key="plate"
)
adata
AnnData object with n_obs × n_vars = 100000 × 15000
    obs: 'drug', 'sample', 'BARCODE_SUB_LIB_ID', 'cell_line_id', 'moa-fine', 'canonical_smiles', 'pubchem_cid', 'plate', 'mean_gene_count', 'mean_tscp_count', 'mean_mread_count', 'mean_pcnt_mito', 'drugname_drugconc', 'targets', 'moa-broad', 'human-approved', 'clinical-trials', 'gpt-notes-approval'
    var: 'highly_variable', 'highly_variable_rank', 'means', 'variances', 'variances_norm', 'highly_variable_nbatches'
    uns: 'hvg'
    layers: None
# merge metadata
adata.obs = adata.obs.merge(
    tahoe_hubmodel.model.adata.obs[
        [
            "Cell_Name_Vevo",
            "dataset",
            "phase",
            "observed_lib_size",
            "S_score",
            "G2M_score",
            "sublibrary",
        ]
    ],
    how="left",
    left_on="BARCODE_SUB_LIB_ID",
    right_index=True,
)
adata.layers["counts"] = adata.X.copy()  # preserve counts
sc.pp.normalize_total(adata, target_sum=1e4)
sc.pp.log1p(adata)
adata.raw = adata  # freeze the state in `.raw`
from sklearn.model_selection import train_test_split

train_ind, valid_ind = train_test_split(
    adata.obs.plate.index.astype(int), test_size=0.9, stratify=adata.obs.plate
)
Init the model#
sample_key = "sample"  # target covariate sample/cell_line_id
batch_key = "plate"  # nuisance variable identifier
MRVI.setup_anndata(
    adata,
    sample_key=sample_key,
    batch_key=batch_key,
    layer="counts",
)
Train mrVI#
import gc
import time

gc.collect()
start = time.time()
model = MRVI(adata)
model.train(
    max_epochs=400,
    early_stopping=True,
    plan_kwargs={"lr": 1e-3, "n_epochs_kl_warmup": 40},
    batch_size=512,
    early_stopping_patience=5,
    check_val_every_n_epoch=1,
    datasplitter_kwargs={"external_indexing": [np.array(train_ind), np.array(valid_ind)]},
)
end = time.time()
print(f"Elapsed time: {end - start:.2f} seconds")
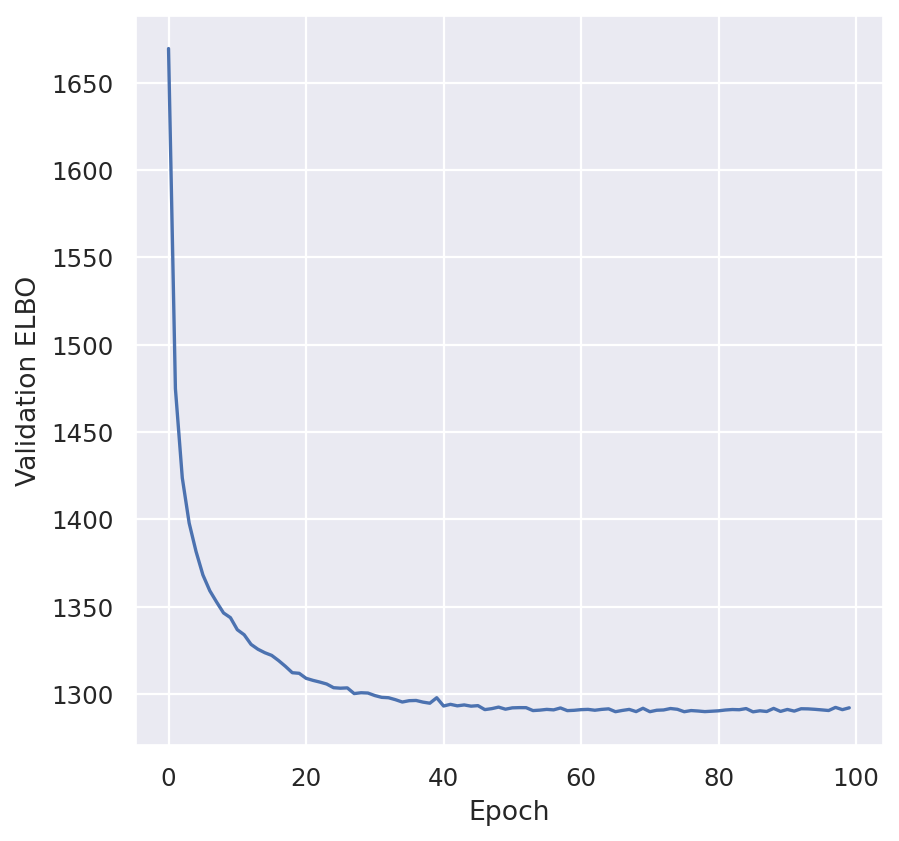
Monitored metric elbo_validation did not improve in the last 5 records. Best score: 1306.211. Signaling Trainer to stop.
Elapsed time: 322.68 seconds
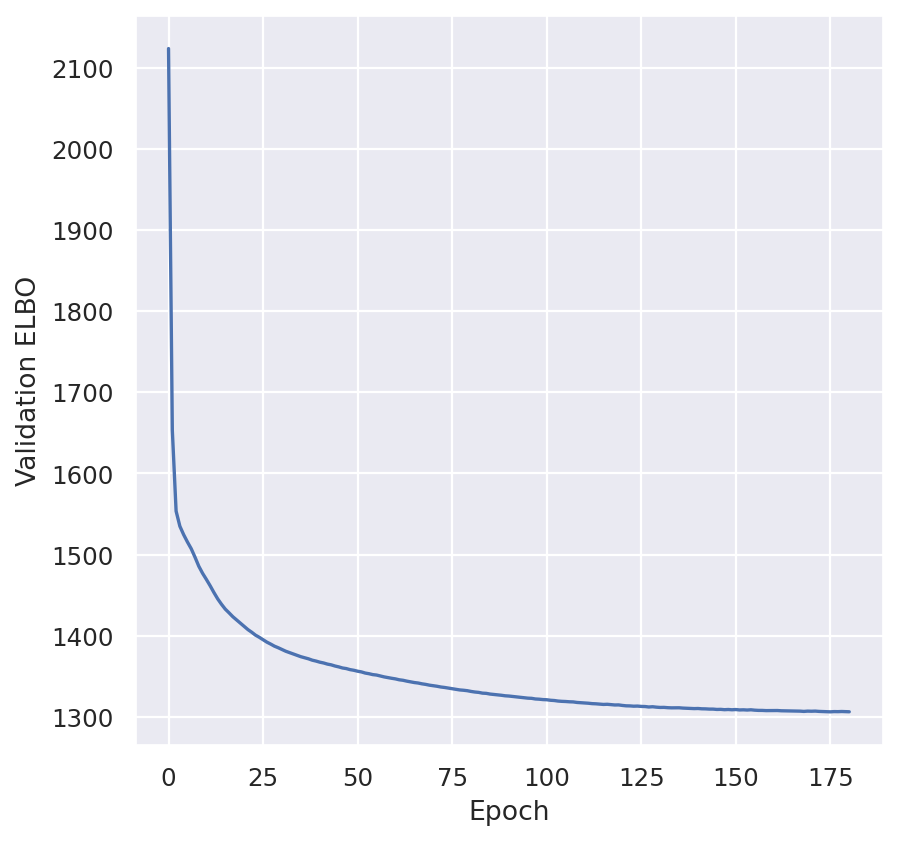
plt.plot(model.history["elbo_validation"])
plt.xlabel("Epoch")
plt.ylabel("Validation ELBO")
plt.show()
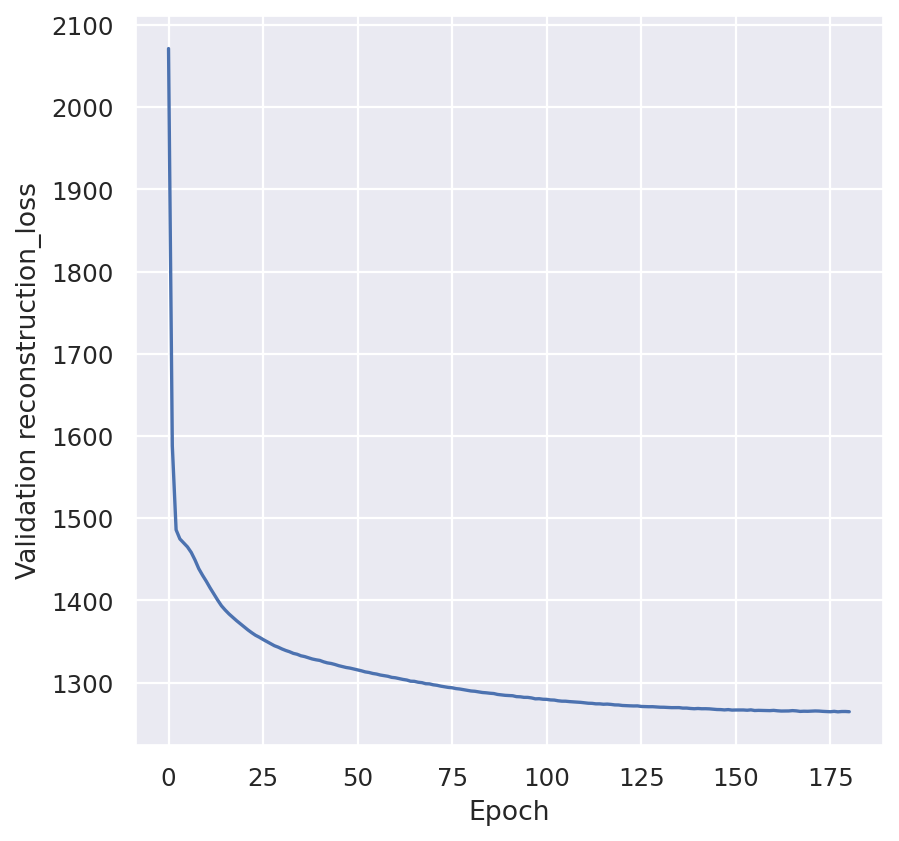
plt.plot(model.history["reconstruction_loss_validation"])
plt.xlabel("Epoch")
plt.ylabel("Validation reconstruction_loss")
plt.show()
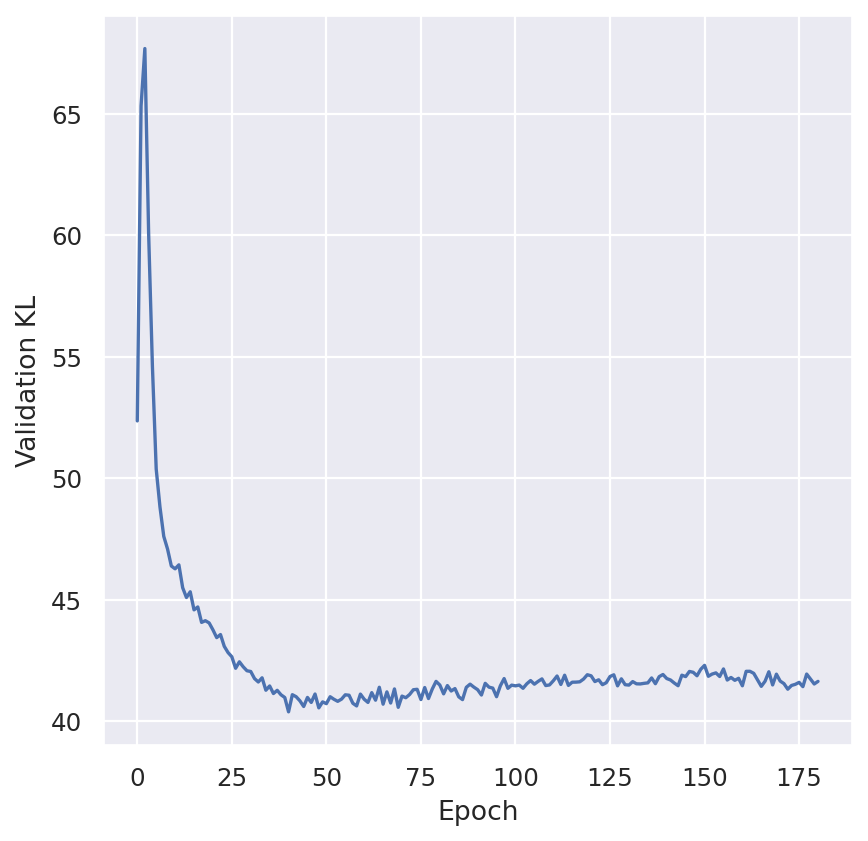
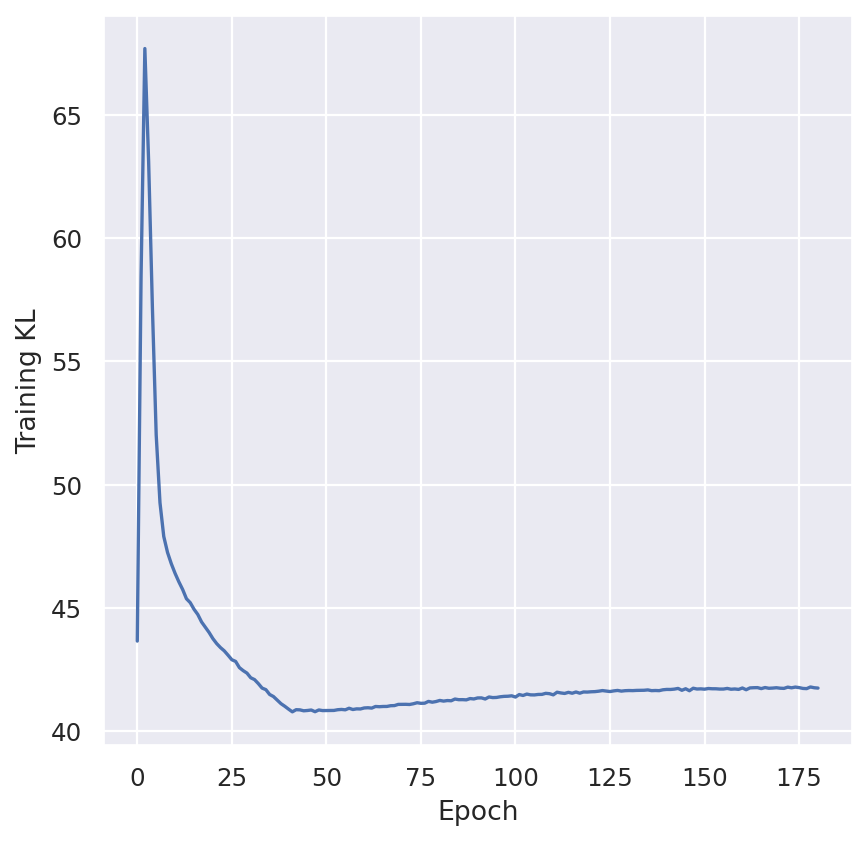
plt.plot(model.history["kl_local_validation"])
plt.xlabel("Epoch")
plt.ylabel("Validation KL")
plt.show()
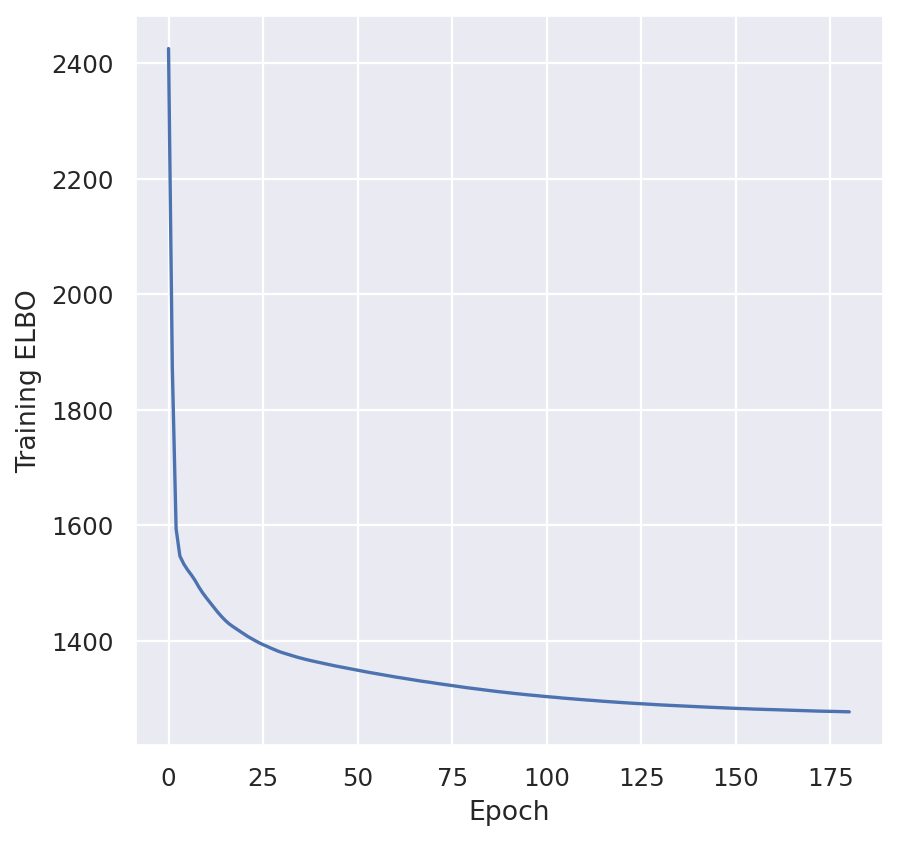
plt.plot(model.history["elbo_train"])
plt.xlabel("Epoch")
plt.ylabel("Training ELBO")
plt.show()
plt.plot(model.history["kl_local_train"])
plt.xlabel("Epoch")
plt.ylabel("Training KL")
plt.show()
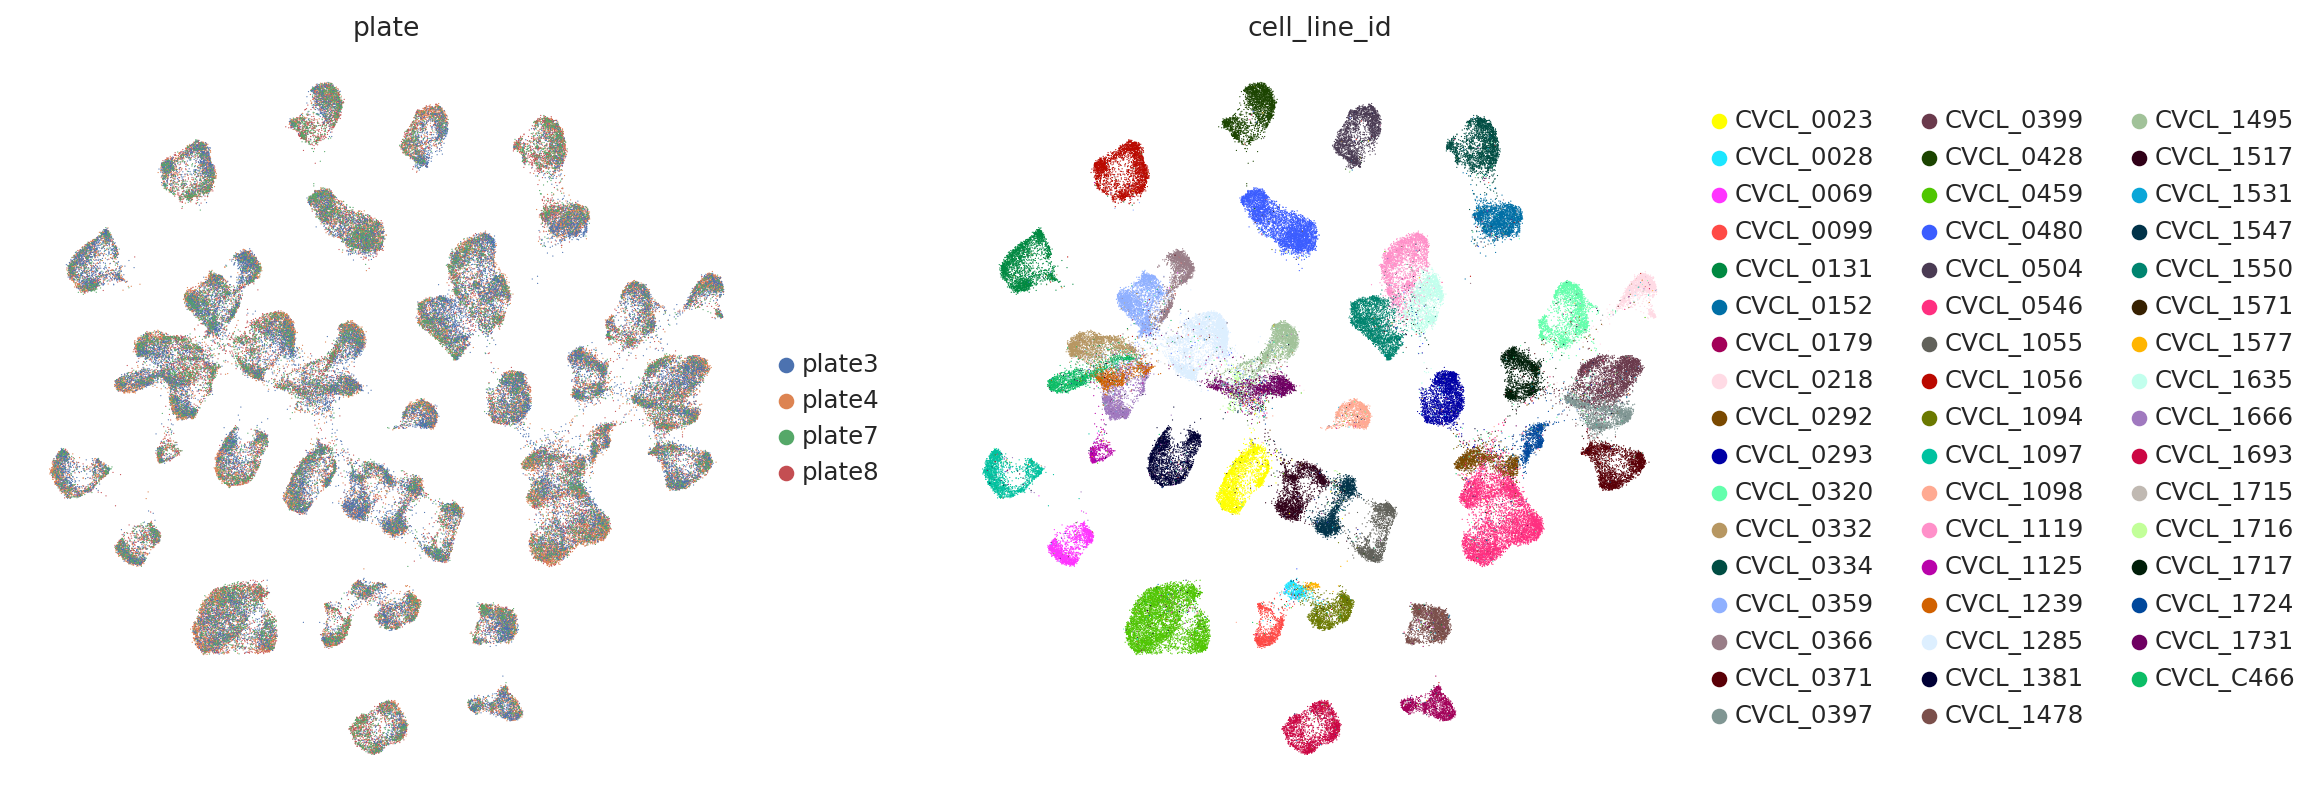
Visualize cell embeddings and sample distances#
The latent representations of the cells can also be accessed and visualized using the get_latent_representation method. MrVI learns two latent representations: u and z. u is designed to capture broad cell states invariant to sample and nuisance covariates, while z augments u with sample-specific effects but remains corrected for nuisance covariate effects.
# run PCA then generate UMAP plots
rsc.tl.pca(adata)
rsc.pp.neighbors(adata, n_pcs=50, n_neighbors=50)
rsc.tl.umap(adata, min_dist=0.1)
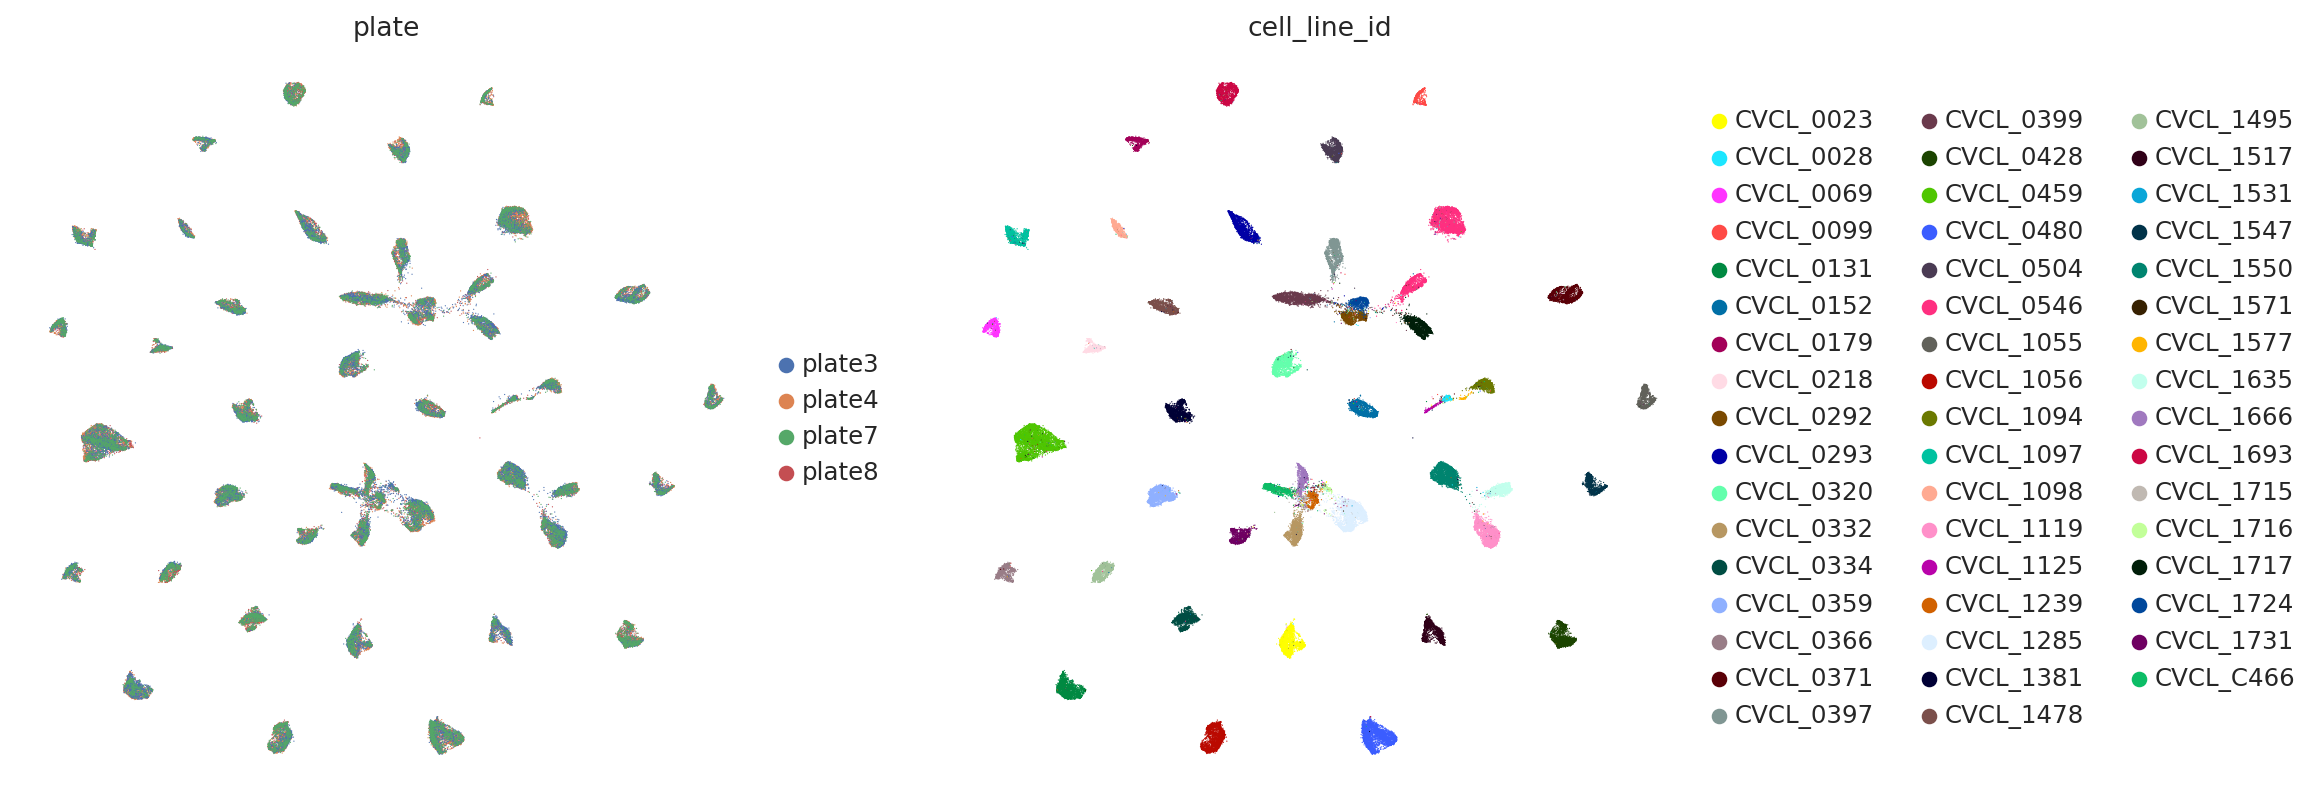
sc.pl.umap(
    adata,
    color=["plate", "cell_line_id"],
    ncols=2,
    frameon=False,
)
u = model.get_latent_representation()
adata.obsm["X_mrVI_Torch"] = u
rsc.pp.neighbors(adata, use_rep="X_mrVI_Torch")
rsc.tl.umap(adata, min_dist=0.3)
u.shape
(100000, 10)
sc.pl.umap(
    adata,
    color=["plate", "cell_line_id"],
    frameon=False,
    ncols=2,
)
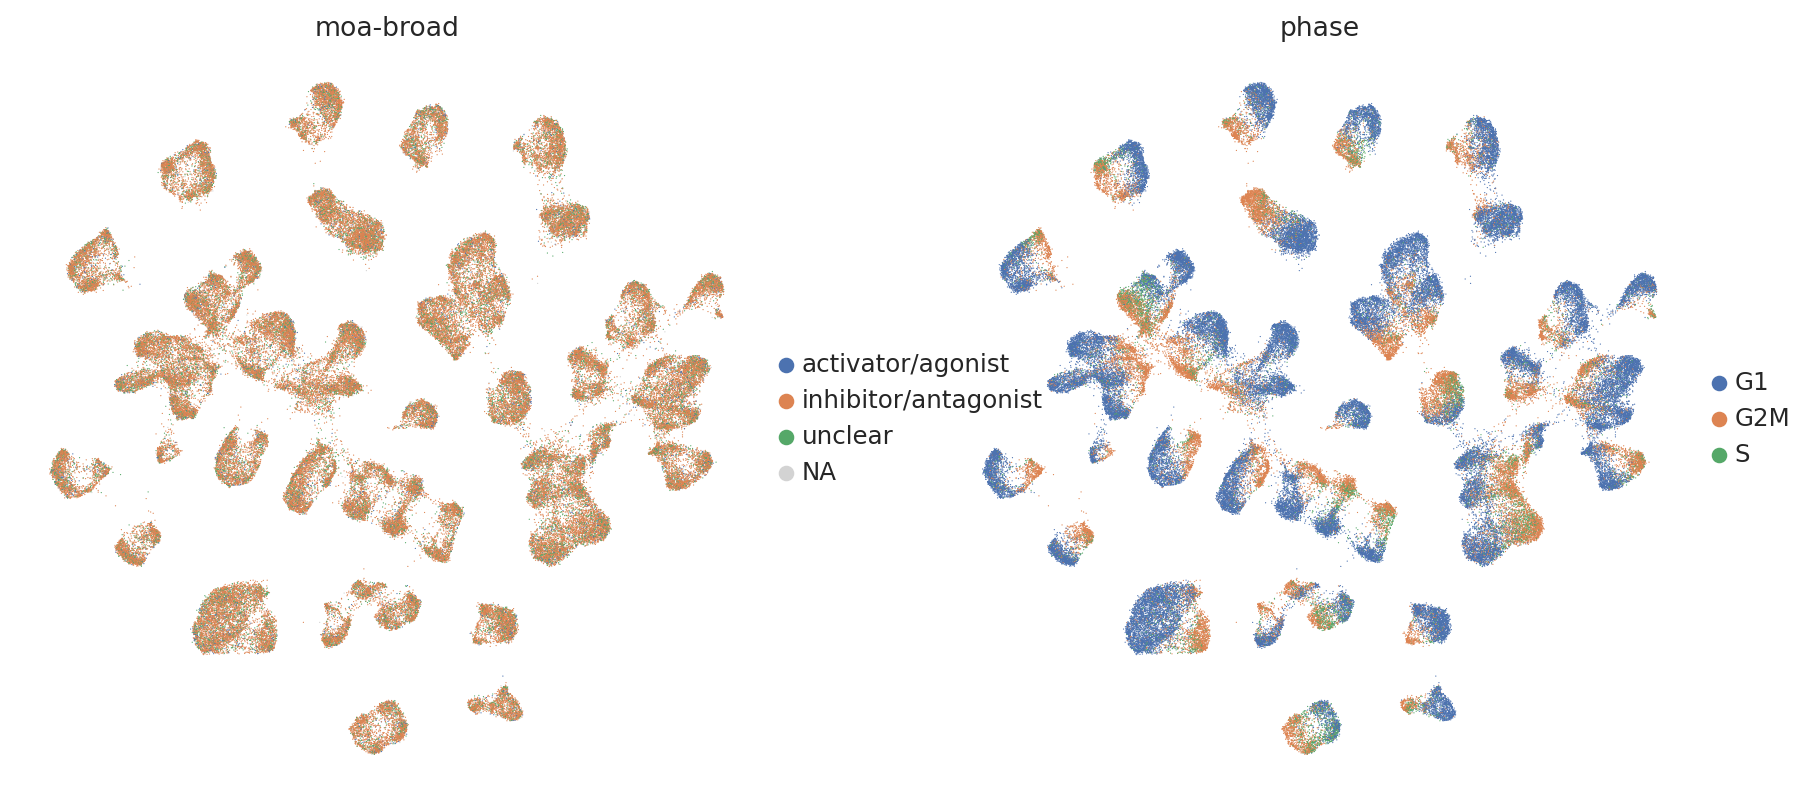
sc.pl.umap(
    adata,
    color=["moa-broad", "phase"],
    frameon=False,
    ncols=2,
)
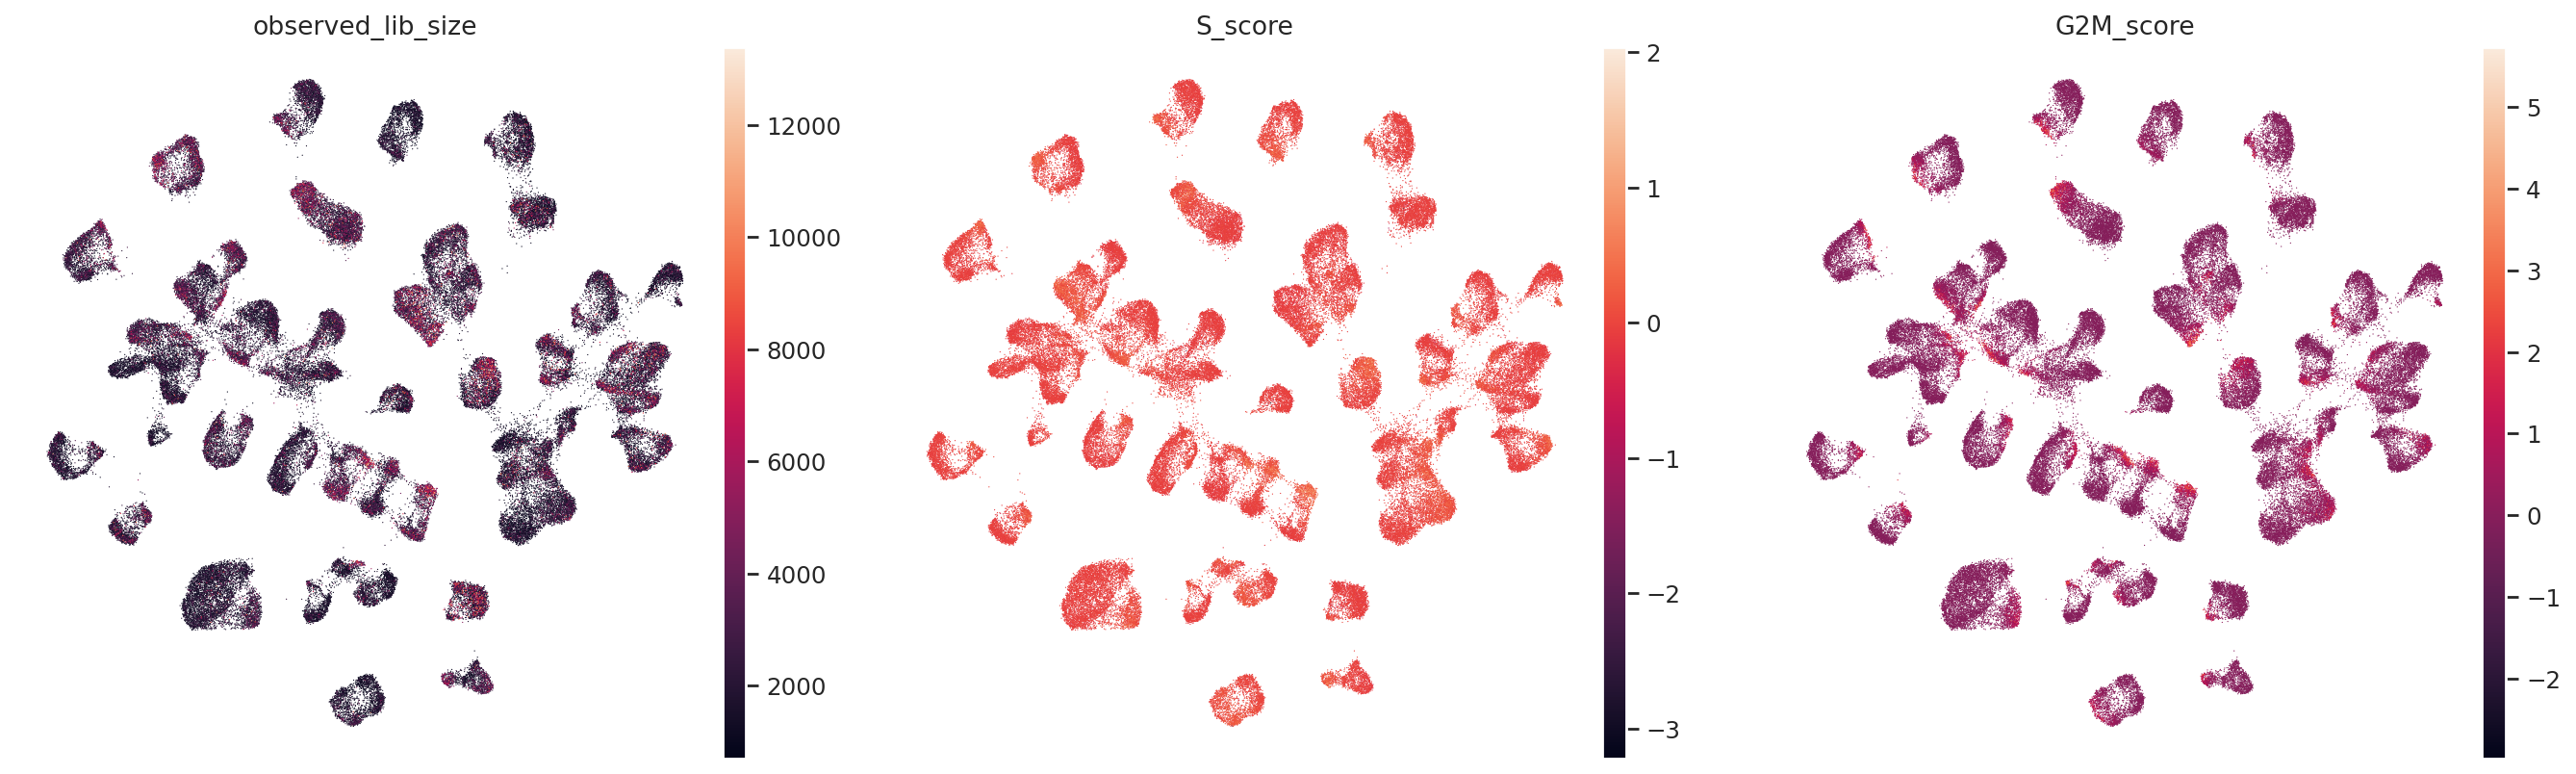
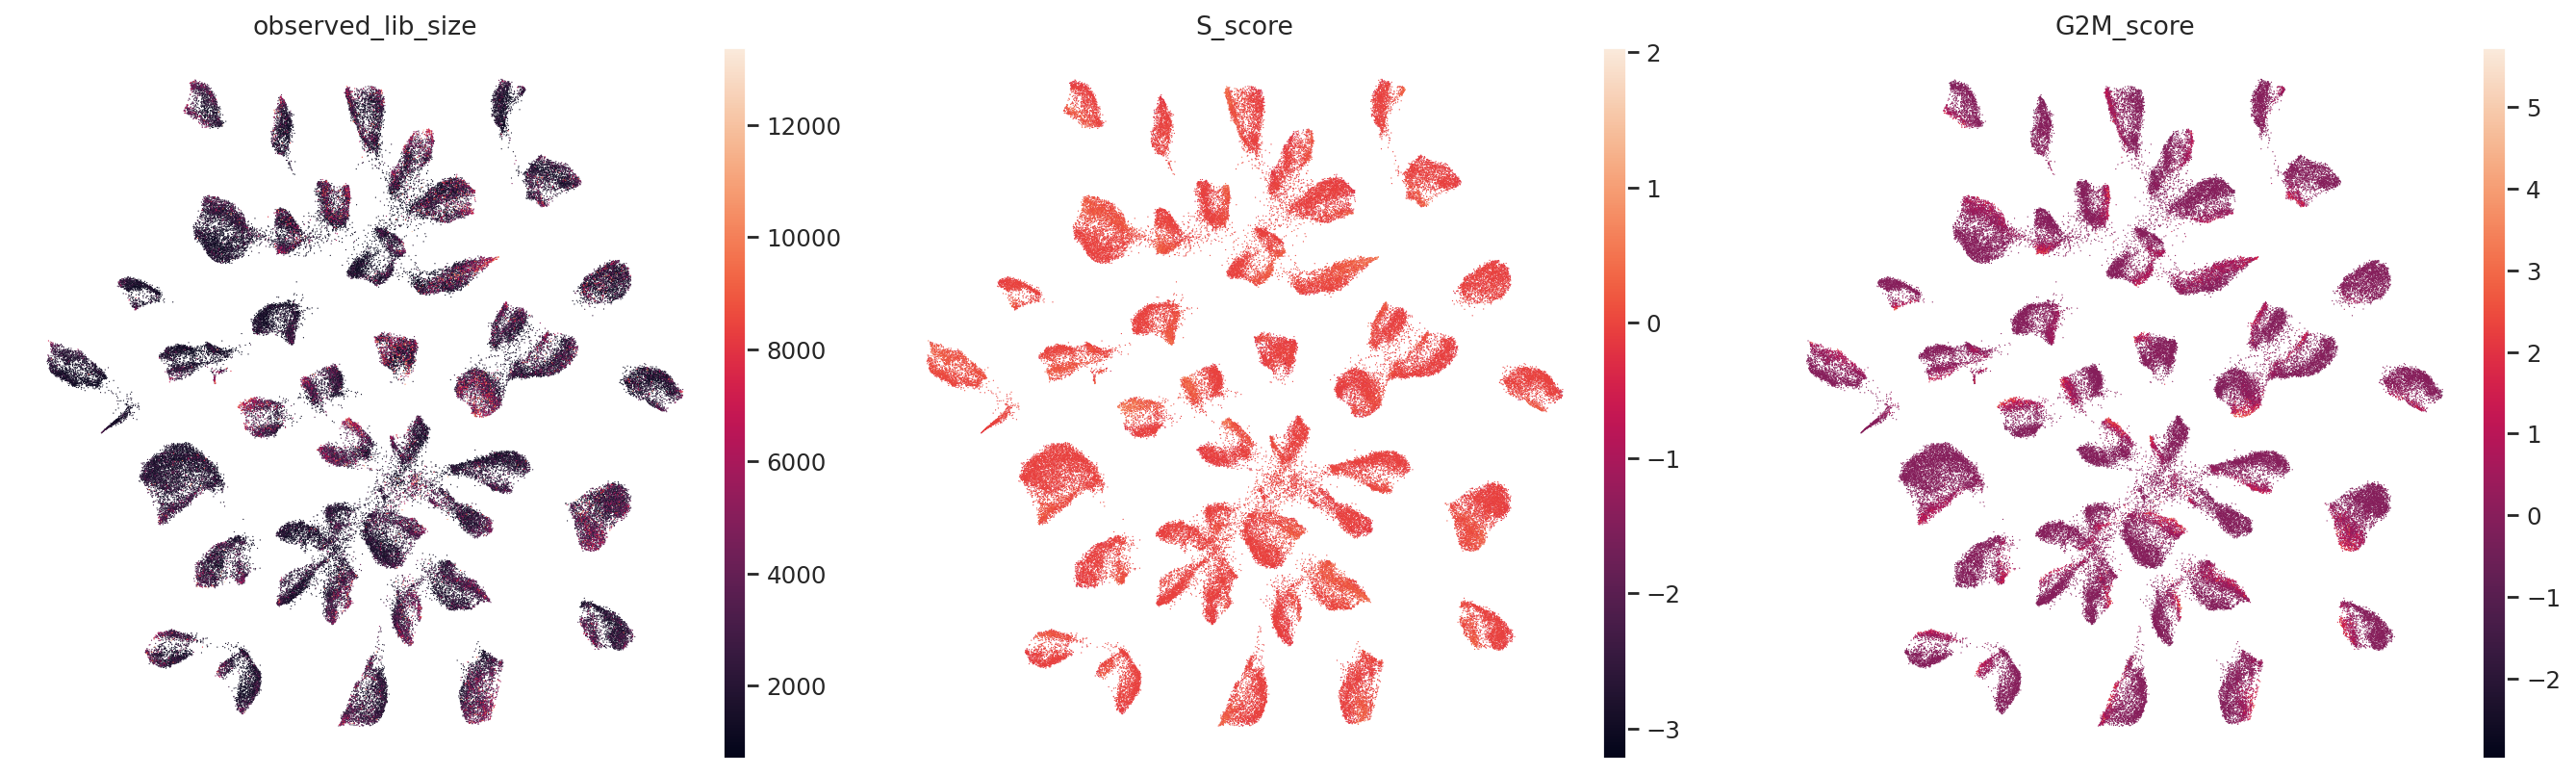
sc.pl.umap(
    adata,
    color=["observed_lib_size", "S_score", "G2M_score"],
    frameon=False,
    ncols=3,
)
Train regular SCVI model for comparison#
scvi.model.SCVI.setup_anndata(adata, layer="counts", batch_key=batch_key)
model_scvi = scvi.model.SCVI(adata)
model_scvi.train(
    max_epochs=100,
    early_stopping=True,
    check_val_every_n_epoch=1,
    datasplitter_kwargs={"external_indexing": [np.array(train_ind), np.array(valid_ind)]},
)
plt.plot(model_scvi.history["elbo_validation"])
plt.xlabel("Epoch")
plt.ylabel("Validation ELBO")
plt.show()
SCVI_LATENT_KEY = "X_scVI"
latent = model_scvi.get_latent_representation()
adata.obsm[SCVI_LATENT_KEY] = latent
latent.shape
(100000, 10)
# use scVI latent space for UMAP generation
rsc.pp.neighbors(adata, use_rep=SCVI_LATENT_KEY)
rsc.tl.umap(adata, min_dist=0.3)
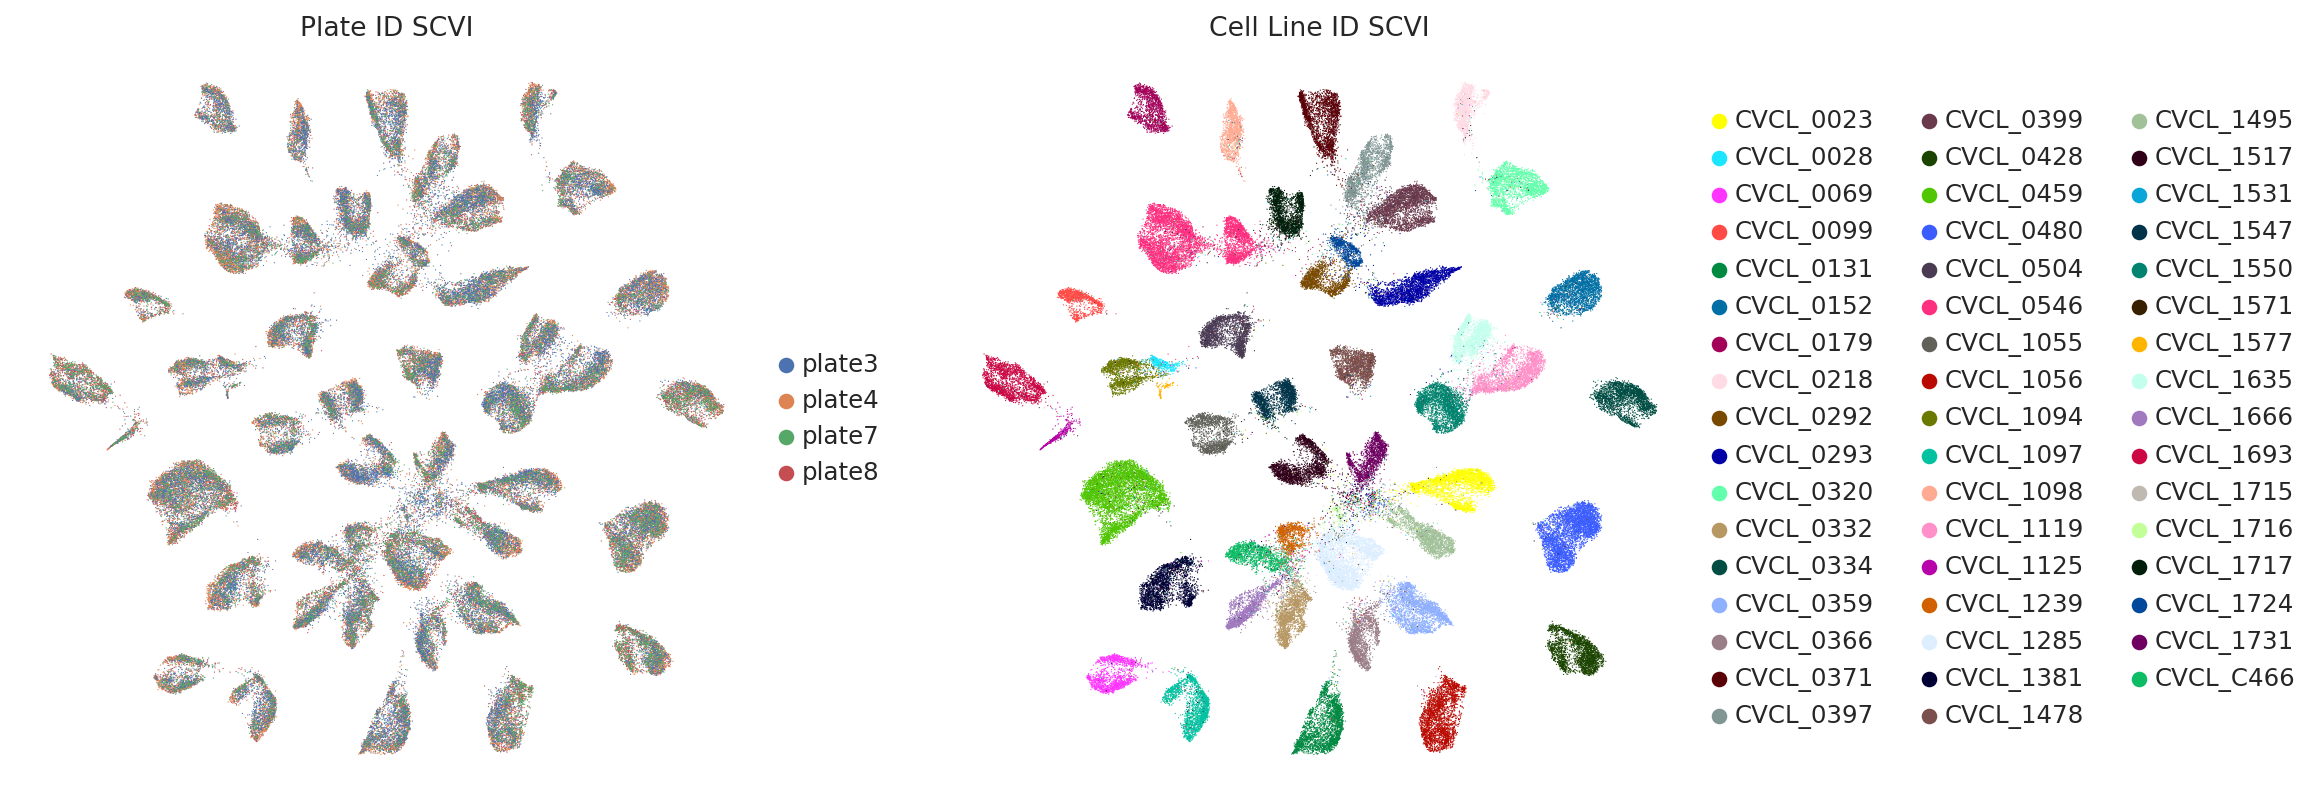
sc.pl.umap(
    adata,
    color=["plate", "cell_line_id"],
    title=["Plate ID SCVI", "Cell Line ID SCVI"],
    ncols=2,
    frameon=False,
)
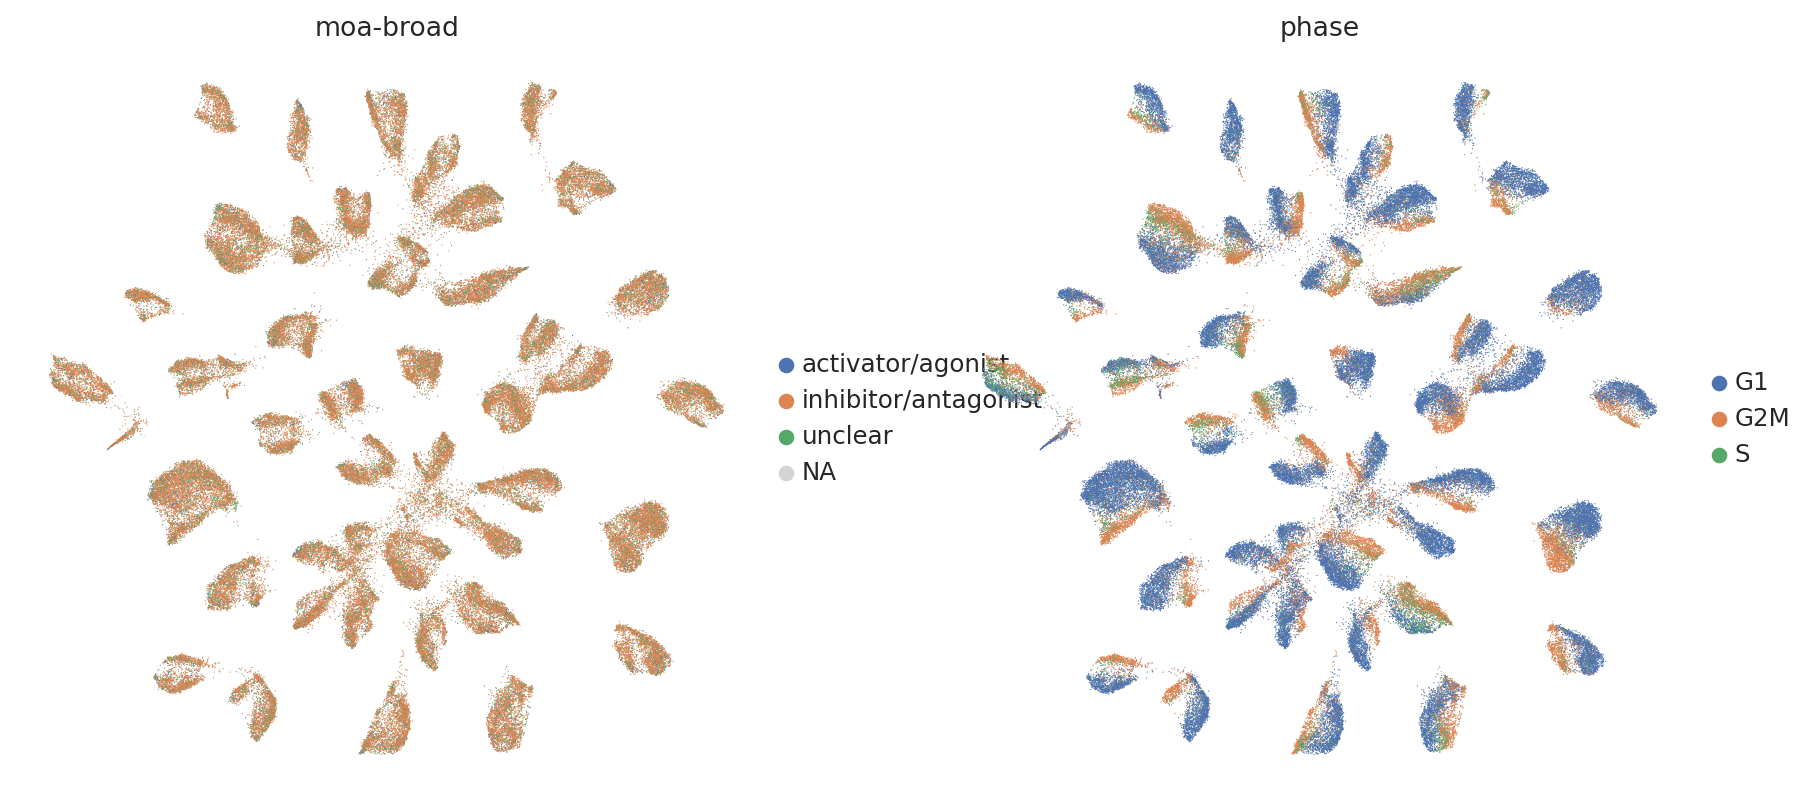
sc.pl.umap(
    adata,
    color=["moa-broad", "phase"],
    frameon=False,
    ncols=2,
)
sc.pl.umap(
    adata,
    color=["observed_lib_size", "S_score", "G2M_score"],
    frameon=False,
    ncols=3,
)
Compare results#
from scib_metrics.benchmark import BatchCorrection, Benchmarker, BioConservation
bm = Benchmarker(
    adata[list(np.random.choice(np.arange(adata.n_obs), size=1000, replace=False)), :],
    batch_key="plate",
    bio_conservation_metrics=BioConservation(
        isolated_labels=True,
        nmi_ari_cluster_labels_leiden=True,
        silhouette_label=True,
        clisi_knn=True,
        nmi_ari_cluster_labels_kmeans=True,
    ),
    batch_correction_metrics=BatchCorrection(
        bras=True,
        pcr_comparison=True,
        kbet_per_label=True,
        graph_connectivity=False,
        ilisi_knn=True,
    ),
    label_key="cell_line_id",
    embedding_obsm_keys=["X_pca", "X_scVI", "X_mrVI_Torch"],
    n_jobs=-1,
)
bm.benchmark()
INFO     CVCL_0028 consists of a single batch or is too small. Skip.
INFO     CVCL_1125 consists of a single batch or is too small. Skip.
INFO     CVCL_1531 consists of a single batch or is too small. Skip.
INFO     CVCL_1577 consists of a single batch or is too small. Skip.
INFO     CVCL_1715 consists of a single batch or is too small. Skip.
INFO     CVCL_1716 consists of a single batch or is too small. Skip.
INFO     CVCL_1724 consists of a single batch or is too small. Skip.
bm.plot_results_table(min_max_scale=False)
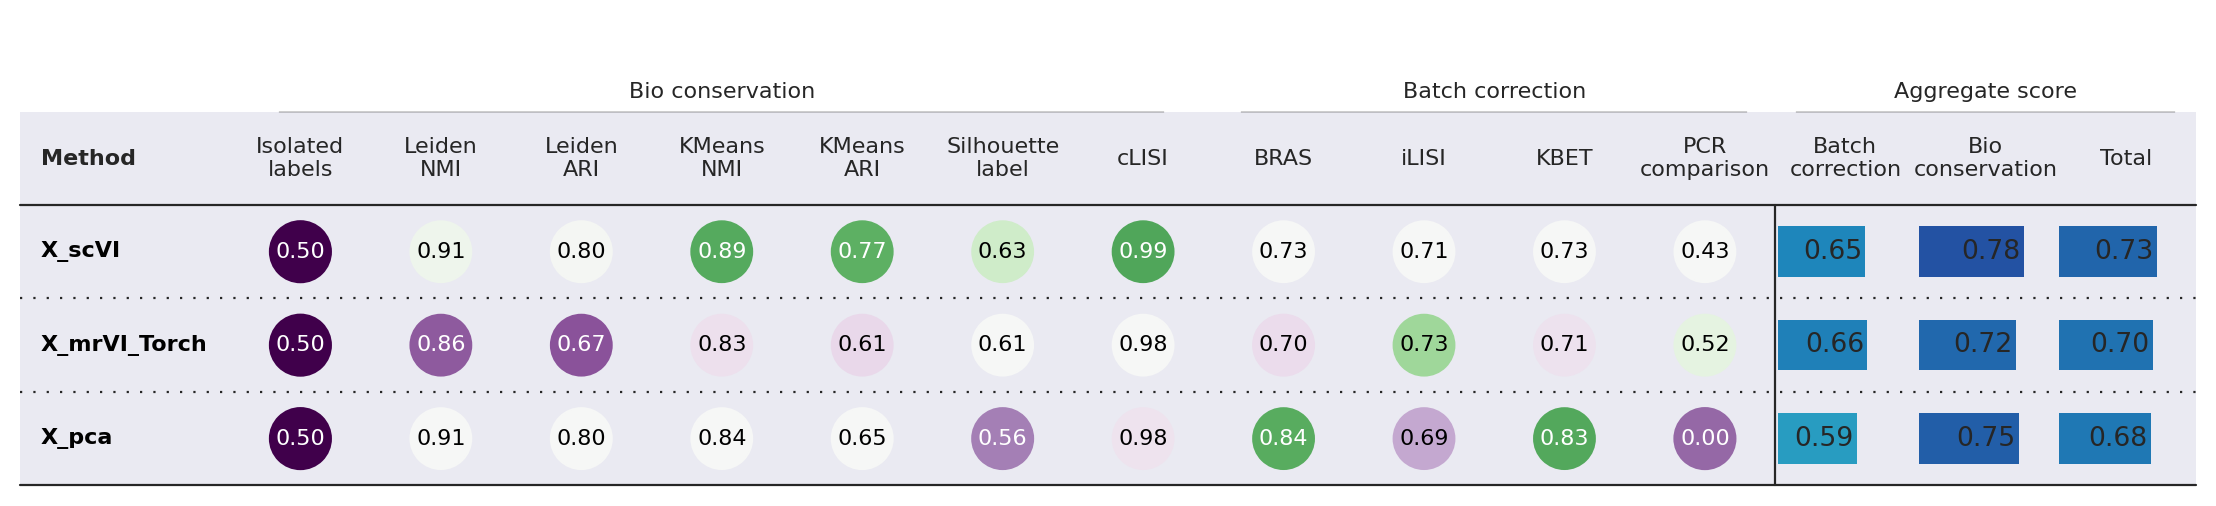
<plottable.table.Table at 0x7f1a2bb60d70>